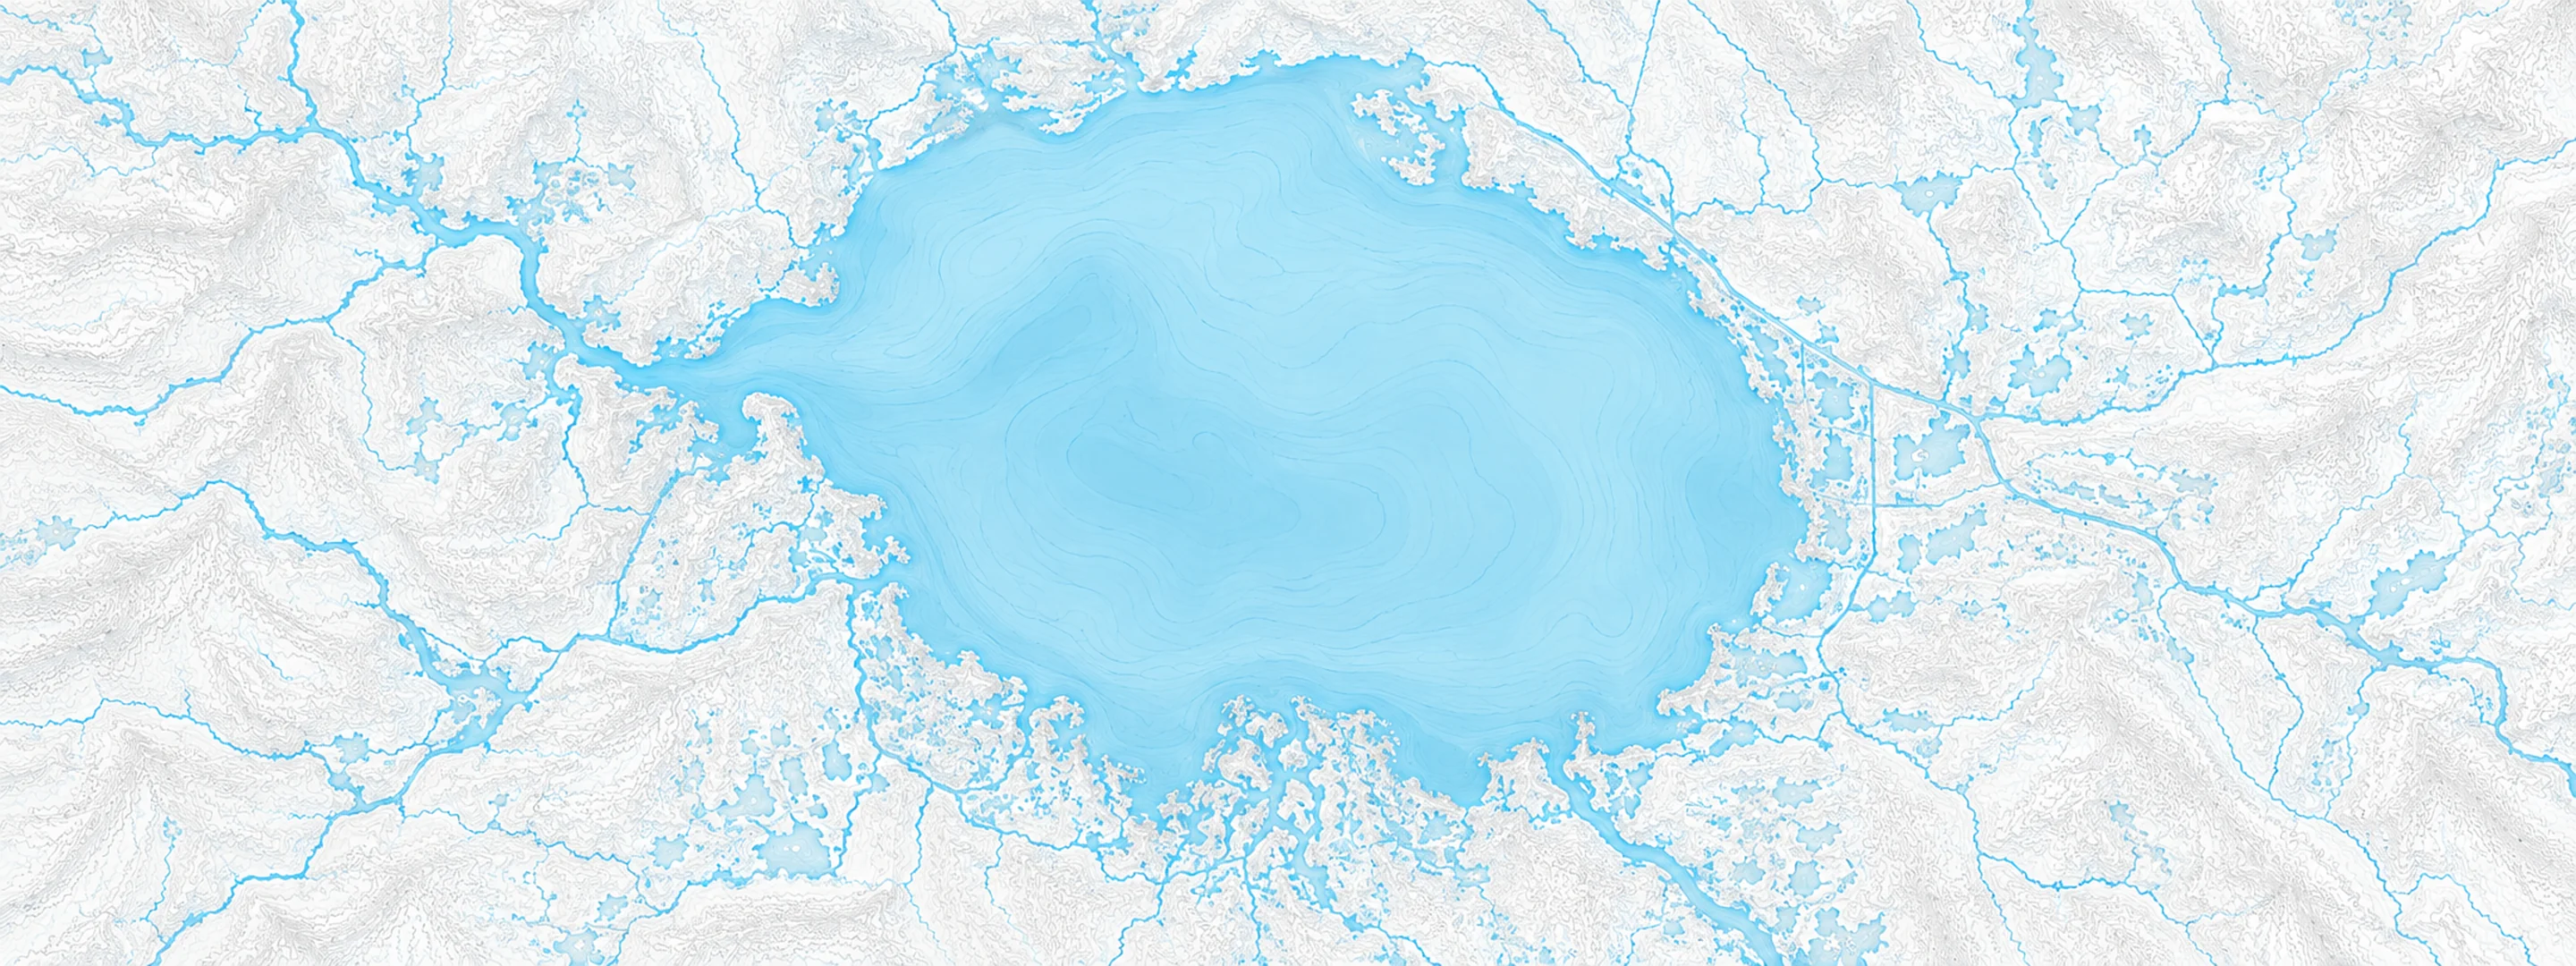
River stage
Quincy, Little River
- River level
- 7.31 ft
- Status
- Below flood stage
- 7-day change
- -3.18 ft
- Recent high
- 11.27 ft
- Recent low
- 0.14 ft
Last reported 2026-10-13 | NWS QCYF1
- 30-day change
- +4.53 ft
- Average
- 2.54 ft
- Readings
- 122
- Data span
- 122 days
- Record crest
- 24.65 ft
In brief
The Little River at Quincy, FL read 7.31 ft on Oct 13, 2026, 4.19 ft below action stage. That is 4.53 ft higher than 30 days earlier.
Source: National Weather Service gauge QCYF1
River level timeline
Stage threshold profile
Highest crests on record
| Rank | Crest | Date |
|---|---|---|
| 1 | 24.65 ft | 1969-09-22 |
| 2 | 20.81 ft | 1964-12-04 |
| 3 | 20.45 ft | 1960-09-27 |
| 4 | 18.80 ft | 1991-03-03 |
| 5 | 17.92 ft | 2018-12-02 |
| 6 | 17.86 ft | 1984-03-07 |
| 7 | 17.19 ft | 2013-02-26 |
| 8 | 16.77 ft | 2020-09-17 |
Flood crests recorded at this gauge by the National Weather Service.
What happens at each level
- 14.00 ft
The river begins to flood into wooded bottomlands along the river.
Written by the local National Weather Service forecast office for this exact gauge.
Frequently asked questions
Is the Little River flooding at Quincy?
No. The Little River at Quincy is at 7.31 ft, 4.19 ft below action stage.
What is the flood stage at Quincy?
The National Weather Service sets action stage 11.5 ft and minor flooding 14 ft.
What is the highest the Little River has been at Quincy?
The highest crest on record is 24.65 ft, on 1969-09-22.
Is the Little River high or low right now at Quincy?
At 7.31 ft it is higher than 92% of readings over the last 122 days.
Stage and flood information from the NOAA National Weather Service (gauge QCYF1); daily history from the U.S. Geological Survey (site 02329500). Last reading 2026-10-13. For flood safety decisions always follow official National Weather Service warnings.